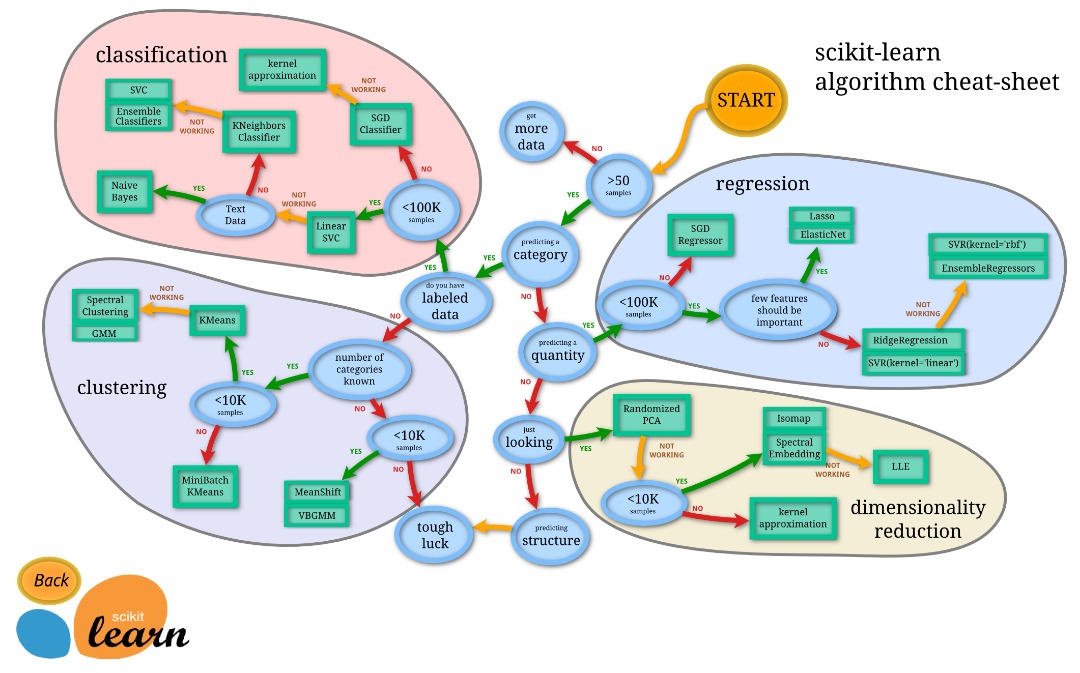
Dans cette partie III nous allons apprendre à manipuler :
- la classe KNeighborsClassifier qui permet de réaliser de la classification par la méthode des
plus proches voisins ou
-means ,
- les fonctions cross_val_score et cross_val_predict qui permettent de réaliser des expériences de validation croisée.
Dans les parties I et II de cette chaine d’articles, nous avons abordé respectivement les régressions linéaires et polynomiales et l’analyse en composante principale (ACP) que je vous conseille à y regarder.
Nous travaillerons pour cela sur le jeu de données breast cancer que l’on peut charger à partir de scikit-learn et dont on trouve un descriptif sur le site de l’UCI.
Nous apprendrons également l’importance de standardiser les descripteurs avec les plus proches voisins.
1. Charger le jeu de données en utilisant la fonction load_breast_cancer du module datasets. En extraire le nombre d’observations et de descripteurs disponibles et représenter sous la forme d’un diagramme en bâton (barplot) les effectifs par classe.
Pour représenter les effectifs on pourra par exemple s’appuyer sur la fonction bincount du package NumPy et sur la fonction bar du package MatPlotlib. In [1]:
# generic imports #
#-----------------#
import numpy as np
import matplotlib
import matplotlib.pyplot as plt
In [2]:
# load dataset #
#--------------#
from sklearn.datasets import load_breast_cancer
db = load_breast_cancer()
print(db.DESCR)
X = db.data
y = db.target
class_ids = db.target_names
n = X.shape[0]
p = X.shape[1]
K = len(class_ids)
print('load dataset of size %d x %d involving %d classes' % (n,p,K))
.. _breast_cancer_dataset:

Breast cancer wisconsin (diagnostic) dataset
--------------------------------------------

**Data Set Characteristics:**

    :Number of Instances: 569

    :Number of Attributes: 30 numeric, predictive attributes and the class

    :Attribute Information:
        - radius (mean of distances from center to points on the perimeter)
        - texture (standard deviation of gray-scale values)
        - perimeter
        - area
        - smoothness (local variation in radius lengths)
        - compactness (perimeter^2 / area - 1.0)
        - concavity (severity of concave portions of the contour)
        - concave points (number of concave portions of the contour)
        - symmetry
        - fractal dimension ("coastline approximation" - 1)

        The mean, standard error, and "worst" or largest (mean of the three
        largest values) of these features were computed for each image,
        resulting in 30 features.  For instance, field 3 is Mean Radius, field
        13 is Radius SE, field 23 is Worst Radius.

        - class:
                - WDBC-Malignant
                - WDBC-Benign

    :Summary Statistics:

    ===================================== ====== ======
                                           Min    Max
    ===================================== ====== ======
    radius (mean):                        6.981  28.11
    texture (mean):                       9.71   39.28
    perimeter (mean):                     43.79  188.5
    area (mean):                          143.5  2501.0
    smoothness (mean):                    0.053  0.163
    compactness (mean):                   0.019  0.345
    concavity (mean):                     0.0    0.427
    concave points (mean):                0.0    0.201
    symmetry (mean):                      0.106  0.304
    fractal dimension (mean):             0.05   0.097
    radius (standard error):              0.112  2.873
    texture (standard error):             0.36   4.885
    perimeter (standard error):           0.757  21.98
    area (standard error):                6.802  542.2
    smoothness (standard error):          0.002  0.031
    compactness (standard error):         0.002  0.135
    concavity (standard error):           0.0    0.396
    concave points (standard error):      0.0    0.053
    symmetry (standard error):            0.008  0.079
    fractal dimension (standard error):   0.001  0.03
    radius (worst):                       7.93   36.04
    texture (worst):                      12.02  49.54
    perimeter (worst):                    50.41  251.2
    area (worst):                         185.2  4254.0
    smoothness (worst):                   0.071  0.223
    compactness (worst):                  0.027  1.058
    concavity (worst):                    0.0    1.252
    concave points (worst):               0.0    0.291
    symmetry (worst):                     0.156  0.664
    fractal dimension (worst):            0.055  0.208
    ===================================== ====== ======

    :Missing Attribute Values: None

    :Class Distribution: 212 - Malignant, 357 - Benign

    :Creator:  Dr. William H. Wolberg, W. Nick Street, Olvi L. Mangasarian

    :Donor: Nick Street

    :Date: November, 1995

This is a copy of UCI ML Breast Cancer Wisconsin (Diagnostic) datasets.
https://goo.gl/U2Uwz2

Features are computed from a digitized image of a fine needle
aspirate (FNA) of a breast mass.  They describe
characteristics of the cell nuclei present in the image.

Separating plane described above was obtained using
Multisurface Method-Tree (MSM-T) [K. P. Bennett, "Decision Tree
Construction Via Linear Programming." Proceedings of the 4th
Midwest Artificial Intelligence and Cognitive Science Society,
pp. 97-101, 1992], a classification method which uses linear
programming to construct a decision tree.  Relevant features
were selected using an exhaustive search in the space of 1-4
features and 1-3 separating planes.

The actual linear program used to obtain the separating plane
in the 3-dimensional space is that described in:
[K. P. Bennett and O. L. Mangasarian: "Robust Linear
Programming Discrimination of Two Linearly Inseparable Sets",
Optimization Methods and Software 1, 1992, 23-34].

This database is also available through the UW CS ftp server:

ftp ftp.cs.wisc.edu
cd math-prog/cpo-dataset/machine-learn/WDBC/

.. topic:: References

   - W.N. Street, W.H. Wolberg and O.L. Mangasarian. Nuclear feature extraction
     for breast tumor diagnosis. IS&T/SPIE 1993 International Symposium on
     Electronic Imaging: Science and Technology, volume 1905, pages 861-870,
     San Jose, CA, 1993.
   - O.L. Mangasarian, W.N. Street and W.H. Wolberg. Breast cancer diagnosis and
     prognosis via linear programming. Operations Research, 43(4), pages 570-577,
     July-August 1995.
   - W.H. Wolberg, W.N. Street, and O.L. Mangasarian. Machine learning techniques
     to diagnose breast cancer from fine-needle aspirates. Cancer Letters 77 (1994)
     163-171.
load dataset of size 569 x 30 involving 2 classes
In [3]:
# show dataset constitution #
#---------------------------#
counts = np.bincount(y)
plt.bar(range(K), counts)
plt.ylabel('number of instances')
plt.title('dataset constitution')
plt.xticks(range(K), class_ids)
plt.show()

2. Estimer les performances de classification de l’algorithme des  -means par validation croisée pour
  et en considérant 10 folds. Quel est l’intérêt d’utiliser un nombre impair de voisins ?
on utilisera pour cela la classe KNeighborsClassifier du module neighbors et la fonction cross_val_score du module model_selection. In [8]:
# carry out cross-validation using cross_val_score #
#--------------------------------------------------#
from sklearn.model_selection import cross_val_score
from sklearn.neighbors import KNeighborsClassifier

k_list = [1,3,5,7]
res = []

for i in range(len(k_list)):
    knn = KNeighborsClassifier(n_neighbors=k_list[i])
    res.append(cross_val_score(knn, X, y, cv = 10) )

# results
print(res)
[array([0.93103448, 0.84482759, 0.92982456, 0.92982456, 0.9122807 ,
       0.89473684, 0.92982456, 0.94642857, 0.89285714, 0.94642857]), array([0.9137931 , 0.86206897, 0.89473684, 0.94736842, 0.94736842,
       0.94736842, 0.96491228, 0.94642857, 0.91071429, 0.92857143]), array([0.9137931 , 0.87931034, 0.89473684, 0.96491228, 0.94736842,
       0.92982456, 0.96491228, 0.92857143, 0.91071429, 0.96428571]), array([0.93103448, 0.86206897, 0.9122807 , 0.96491228, 0.92982456,
       0.92982456, 0.96491228, 0.92857143, 0.91071429, 0.94642857])]
3. La fonction cross_val_score calcule la performance de prédiction obtenue dans les différentes folds. Représenter par un “boxplot” la distribution des performances obtenues par fold pour les différentes valeurs de  , et sélectionner la valeur de
  conduisant à la meilleure performance médiane.
On pourra s’appuyer sur la fonction boxplot du package MatplotLib. Elle permet de tracer sur un même graphique plusieurs boxplot à partir d’une matrice ou d’une liste. In [9]:
# compare performance obtained #
#------------------------------#
plt.boxplot(res, labels = k_list)
plt.title('fold-level accuracy vs k value')
plt.show()
# select optimal k value #
#------------------------#
ind_best = np.argmax( np.median(res, 1) )
k_best = k_list[ind_best]
print('best k value obtained = %d' % k_best)

best k value obtained = 3
4. Pour avoir une vision plus détaillée des résultats de classification il peut-être intéressant de calculer une matrice de confusion. La fonction cross_val_predict du module model_selection permet de réaliser une expérience de validation croisée en fournissant les prédictions “brutes” plutôt qu’une mesure de performance de classification.
Utiliser cette fonction pour la valeur de retenue précédemment et calculer la matrice de confusion obtenue en utilisant la fonction confusion_matrix du module metrics. Utilisez la fonction classification_report du module metrics pour calculer les indicateurs usuels que l’on peut déduire de cette matrice de confusion. In [10]:
# get cross-validation predictions & show confusion matrix #
#----------------------------------------------------------#
# get predictions
from sklearn.model_selection import cross_val_predict
knn = KNeighborsClassifier(n_neighbors=k_best)
cv_preds = cross_val_predict(knn, X, y, cv = 10)
# compute confusion matrix
from sklearn.metrics import confusion_matrix
print(confusion_matrix(y, cv_preds))
# show "classification report"
from sklearn.metrics import classification_report
print(classification_report(y, cv_preds))
[[185  27]
 [ 15 342]]
              precision    recall  f1-score   support

           0       0.93      0.87      0.90       212
           1       0.93      0.96      0.94       357

    accuracy                           0.93       569
   macro avg       0.93      0.92      0.92       569
weighted avg       0.93      0.93      0.93       569
5. Reprendre cette analyse en standardisant au préalable les descripteurs
On pourra par exemple utiliser la classe StandardScaler du module preprocessing pour standardiser les descripteurs. In [11]:
# do the same from scaled data #
#------------------------------#
# scale data
from sklearn.preprocessing import StandardScaler
scaler = StandardScaler()
X_norm = scaler.fit_transform(X)
# carry out cross-validation
res_scale = []
for i in range(len(k_list)):
    knn = KNeighborsClassifier(n_neighbors=k_list[i])
    res_scale.append( cross_val_score(knn, X_norm, y, cv = 10) )
# pick best model
ind_best = np.argmax(np.median(res_scale,1))
k_best = k_list[ind_best]
knn = KNeighborsClassifier(n_neighbors=k_best)
# get predictions
cv_preds = cross_val_predict(knn, X_norm, y, cv = 10)
# show results
print(confusion_matrix(y, cv_preds))
print(classification_report(y, cv_preds))
[[197  15]
 [  4 353]]
              precision    recall  f1-score   support

           0       0.98      0.93      0.95       212
           1       0.96      0.99      0.97       357

    accuracy                           0.97       569
   macro avg       0.97      0.96      0.96       569
weighted avg       0.97      0.97      0.97       569


